Debugging with VS Code
Visual Studio Code is an IDE - integrated development environment. A fancy text editor that plugs into a lot of other tools.
It doesn’t debug code. But it does provide an interface for you to connect to debugging tools!
There are extensions for almost every language out there. I was able to set up Python and C++ debugging in a few minutes. It’s as simple as:
- Open a .py file
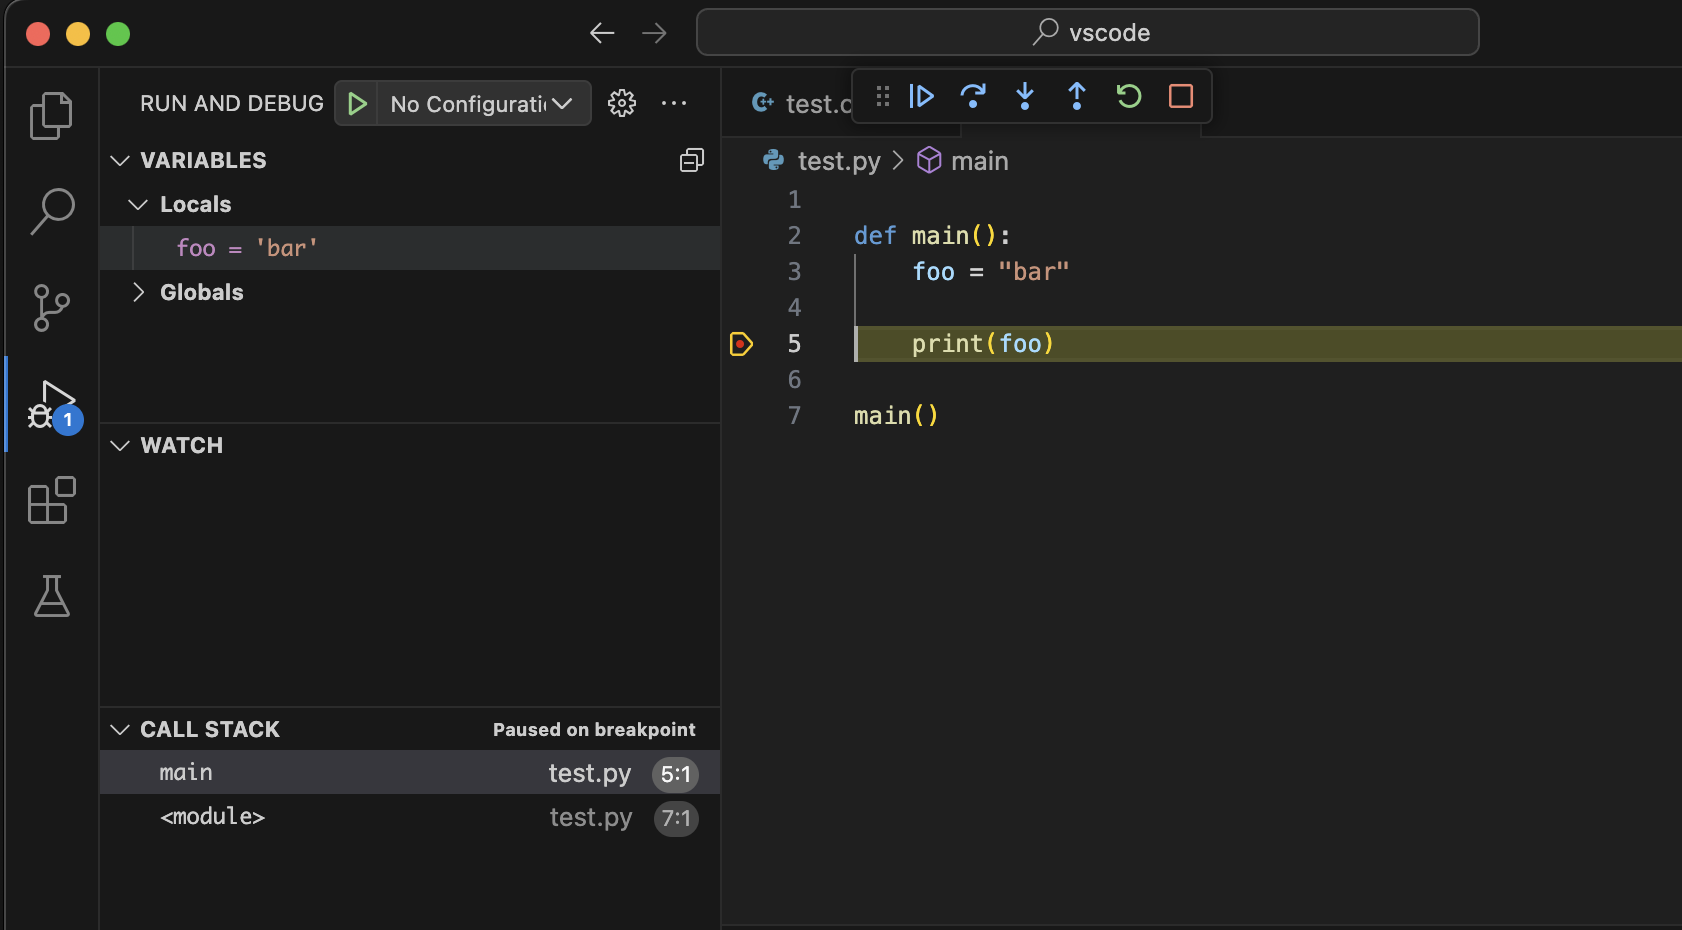
- Switch to Run and Debug (left menu, arrow pointing right with a bug icon)
- Click Run and Debug
- Follow the prompts to install the Python extension
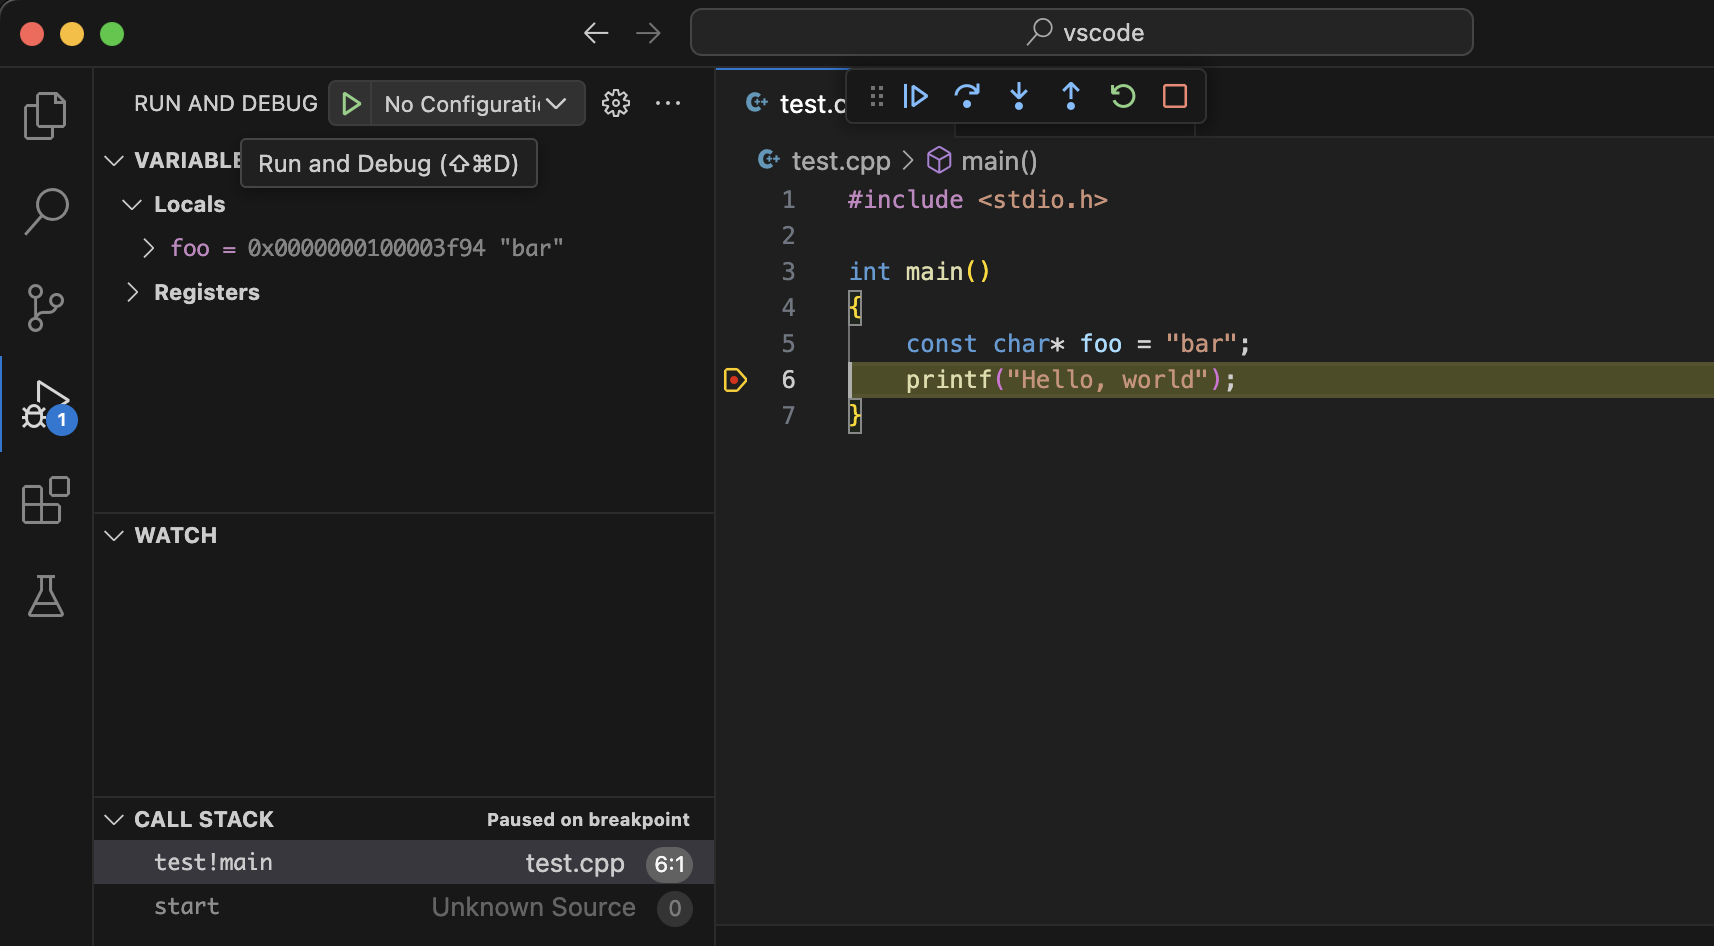
Once set up, you can set breakpoints, inspect the call stack, and more in a consistent interface. You can see how similar debugging Python is to C++.
You can also launch or attach to Chrome to remotely debug JavaScript.
Let me know if you run into any issues with this or have any questions. Happy debugging!